Dashboards with Google Gemini: From “Where’s the Data?” to “Ohhh, That’s the Story”
A practical, no-fluff way to use Google Gemini as your copilot for building dashboards—KPIs, SQL drafts, stakeholder-friendly summaries, and the common traps to avoid.

Imagine this: it’s Monday morning, someone pings you “Hey, can you pull a quick dashboard for leadership?” and your brain immediately does that tiny panic-scream. You’ve got data in BigQuery, some KPIs living in Google Sheets, and a vague hope that Looker Studio won’t decide to be weird today. Been there.
The good news? Google Gemini can take a lot of the annoying parts of dashboard building—writing queries, naming metrics, summarizing trends, and even drafting the narrative—so you can focus on the part humans are actually good at: deciding what matters.
The real problem: dashboards fail for boring reasons
Most dashboards don’t fail because charts are ugly. They fail because:
- Unclear question: “Revenue dashboard” isn’t a question. “Why did revenue dip last week?” is.
- Metric soup: 47 tiles, no decisions.
- Data friction: Someone needs SQL, someone needs permissions, someone needs a miracle.

My stance: a dashboard is a product. If it doesn’t help someone decide faster, it’s just expensive wall art.
So where Gemini fits (and where it doesn’t)
Think of Gemini like a smart intern who’s great at drafts. It can:
- Help you clarify KPIs (“What’s the best definition of activation for a B2B app?”)
- Generate SQL starter queries for BigQuery
- Suggest dimensions to segment by (channel, cohort, plan tier)
- Summarize trends into plain English for stakeholder updates
But it won’t magically fix garbage data, missing tracking, or the fact that your company can’t agree on what “active user” means. (Nothing can. Not even therapy. Kidding. Mostly.)
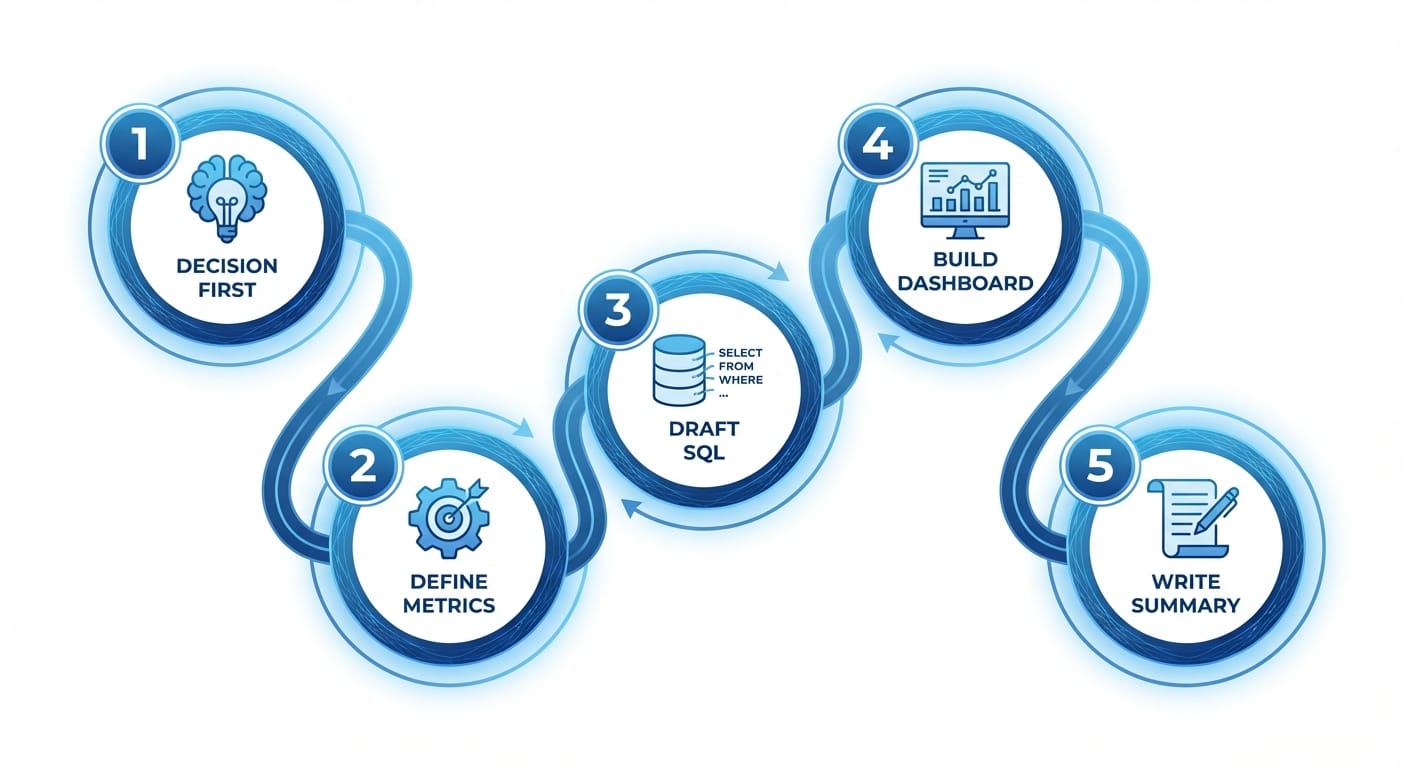
My 5-step playbook for building a dashboard with Gemini
I’m going to keep this practical. Here’s the workflow I use when I want speed and quality.
1) Start with the decision, not the chart
Ask: “What decision will this dashboard support?” Hiring? Budget shifts? Fixing churn? If you can’t name the decision, you’re about to build a dashboard that nobody opens after week one.
Gemini prompt I like: I'm building a dashboard for [role]. The decision is [decision]. What 5 KPIs and 5 supporting breakdowns would you recommend, and why?
2) Define metrics like you’re writing a contract
Dashboards get political fast. The best defense is a metric definition doc (even if it’s just a Google Doc).
Have Gemini draft definitions, then you tighten them. Example: “Net Revenue” should specify refunds, taxes, FX conversions, date fields (order date vs invoice date), etc.
Source note: Metric clarity matters because BI tools are only as trustworthy as the definitions feeding them; Looker’s modeling layer (LookML) is literally designed around consistent metric logic across reports [Google Cloud Looker Docs].
3) Use Gemini to draft SQL (then you review it like an adult)
If your data is in BigQuery, Gemini can help you crank out SQL fast. But don’t just copy/paste into production and pray. Review joins, date filters, and granularity.
Gemini prompt: Write a BigQuery SQL query for: daily active users by channel. Tables: events(user_id, event_name, event_ts, channel), users(user_id, created_ts). DAU = distinct users with any event. Use last 30 days.
BigQuery specifics (partitioning, clustering, cost awareness) still matter. BigQuery charges by data processed, so tight filters and partition pruning aren’t “nice”—they’re money [BigQuery Pricing].
4) Build the dashboard in Looker Studio (or Looker) with Gemini as your copilot
Let’s be real: most teams doing “dashboards” in Google-land are using Looker Studio because it’s fast and accessible. Looker (the full product) is better for governed metrics at scale.
Either way, Gemini helps on the human parts:
- Chart selection: “What’s the best visualization for retention by cohort?”
- Layout: “How should I structure this for an exec who scans in 20 seconds?”
- Copy: titles that say what happened, not what the chart type is
Also: keep your first dashboard version brutally simple. One page. Top 6–10 tiles max. If you need a scroll bar, you’ve already lost half your audience.
5) Add an “Executive Summary” that writes itself (almost)
This is the part nobody does, and it’s why dashboards don’t change behavior.
Pull 3–5 highlights weekly: what moved, why it likely moved, and what you recommend doing. Gemini is great at drafting this narrative if you give it the numbers and context.
Gemini prompt: Here are this week's KPI deltas: [paste]. Write a 5-bullet exec summary with likely drivers and 2 recommended actions. Keep it non-technical.
Google positions Gemini as an assistant across Workspace (Docs/Sheets/Slides), which is exactly where that narrative usually lives [Google Workspace Gemini].
Common mistakes (aka: how dashboards become junk drawers)
- Mistake: Tracking everything. Fix: Track what drives decisions. Your CEO doesn’t need button-click counts.
- Mistake: No date context (WoW, MoM, YoY). Fix: Always show change over time and define the comparison window.
- Mistake: Mixing grains (daily revenue next to monthly churn) with no labels. Fix: Standardize time grains per section.
- Mistake: Letting Gemini be the “source of truth.” Fix: Gemini drafts; your data model decides.
Pro Tips Box (stuff I wish someone told me earlier)
1) Name tiles like headlines. “Churn rose 1.2 pts” beats “Churn Rate (Line Chart).”
2) Put filters where eyeballs go first. Top row, left side. Don’t make people hunt.
3) Build a QA tab. One hidden page with row counts, null rates, and freshness timestamps.
4) Cache the expensive stuff. If your query scans a billion rows for a tiny chart, you’re doing it wrong.
FAQ
Does Gemini build the dashboard automatically?

Not end-to-end like a magic “dashboard button.” It’s better as a copilot: planning KPIs, drafting SQL, writing summaries, and helping structure the dashboard.
Looker Studio or Looker—what should I use?
If you need speed and sharing: Looker Studio. If you need governed metrics, reusable models, and serious scale: Looker. LookML exists for a reason—consistent definitions across the org [LookML Docs].
Is it safe to paste company data into Gemini?
Depends on your organization’s policies and the specific Gemini setup you’re using (consumer vs enterprise controls). When in doubt: don’t paste sensitive raw data. Use aggregates, anonymize, or work inside approved enterprise tooling and settings.
Action challenge: ship a “one-question” dashboard this week
Here’s your challenge: pick one decision (like “Are we retaining new users?”), build a one-page dashboard around it, and have Gemini draft a 5-bullet executive summary. Then send it to one stakeholder and ask: “What would you do differently after seeing this?”
If they can answer, you’ve got a real dashboard. If they can’t… congrats, you just saved yourself from building wall art.